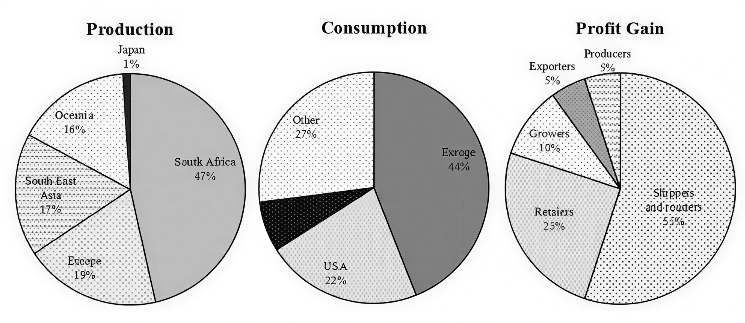
The three pie charts compare global patterns of coffee production and consumption and show how profits from coffee sales are distributed. Overall, coffee is largely produced in one main region but mostly consumed elsewhere, and the greatest share of profit goes to intermediaries rather than to the original producers.
In terms of production, South Africa is by far the most important source of coffee, accounting for 47% of total output. Much smaller but still notable proportions come from Europe, South East Asia and Oceania, with figures of 19%, 13% and 16% respectively. Japan, by contrast, contributes only 1% of global production.
Consumption, however, is dominated by Europe, which is responsible for 44% of worldwide intake. The USA accounts for 24%, while other regions together make up 22%. Japan again represents the smallest segment, at about 8%. This contrast shows that the main consumers are not the same as the main producers and therefore rely heavily on imports.
The distribution of profit is even more uneven. Shippers and roasters gain the dominant share, at around 55% of the total, while retailers receive a further 15%. By comparison, growers earn only 10%, and exporters and producers each receive just 5%. Taken together, those who cultivate and supply the raw coffee beans obtain only a minority of the overall profit.
In summary, the charts highlight a clear imbalance: coffee is grown mainly in producing regions such as South Africa, yet it is consumed and profited from largely in importing markets, where companies involved in processing and selling the product capture most of the financial gains.